
Research on wheelchair form design based on Kansei engineering and GWO-BP neural network

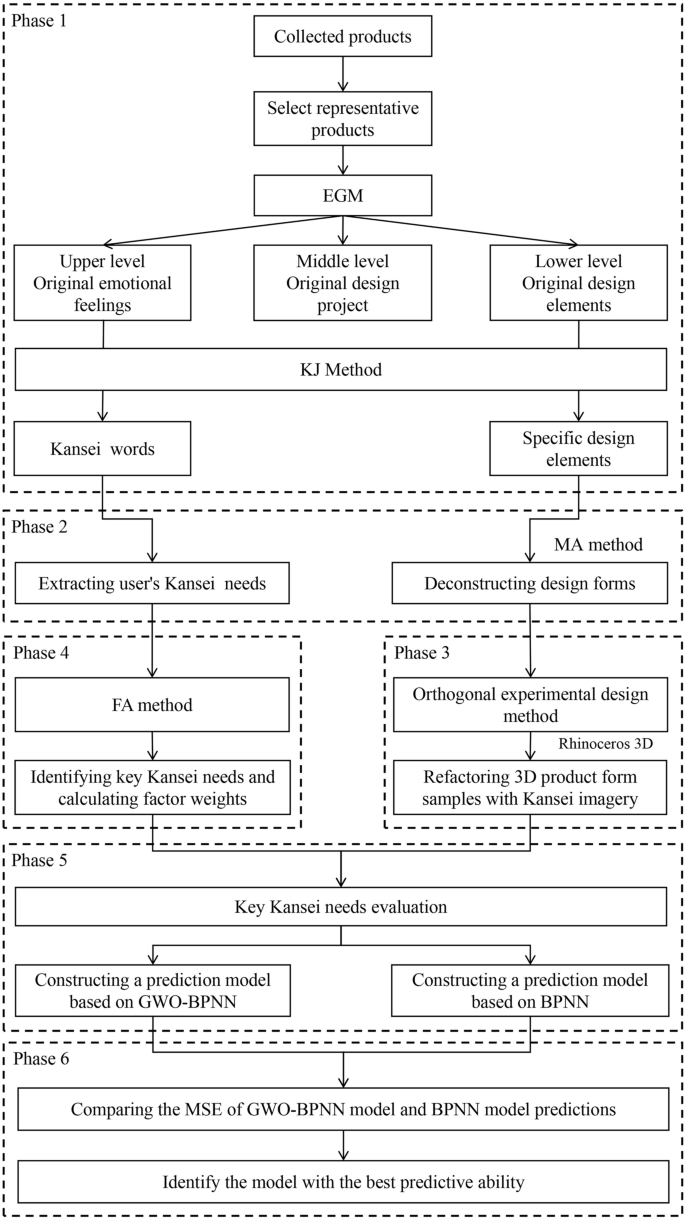
This study uses the KE method and EGM and GWO-BPNN technology to conduct a comprehensive quantitative and qualitative analysis of wheelchair shape design. The research process is shown in Fig. 3, divided into the following stages: Phase 1: Extracting the original attraction items of the wheelchair shape through EGM, the abstract emotions of the upper layer, and the design items of the lower layer. Phase 2: Based on the results of EGM, extract users’ Kansei needs and deconstruct wheelchair form design projects and design categories using the form analysis method. Phase 3: Using Rhinoceros 3D modelling software, convert the categories of design elements in 2D form into 3D shapes and construct a preliminary product plan of a 3D conceptual model as the evaluation object for the next stage (wheelchair concept plan). Phase 4: Use FA to calculate the weights of Kansei factors and identify key Kansei demand factors. Conduct a critical Kansei words evaluation of the wheelchair representative scheme. Then, essential Kansei demand evaluation and prediction models based on BPNN and GWO-BPNN will be established, respectively. Finally, compare and analyze the results of these two prediction models to verify their effectiveness and feasibility. The experimental procedures were approved by the Bioethics Committee of the East China University of Science and Technology, and all methods were performed in accordance with the relevant guidelines and regulations. All participants gave their informed consent.
Identification of attractive factors
In this study, EGM was used to identify attractiveness factors. The specific steps are as follows:
Step 1: Collect and screen representative samples. Through various channels such as online shopping platforms, official websites of wheelchair brands, Design website, and consulting magazines and books, 234 wheelchair product sample images were collected. After screening the collected images to remove pixel blur and images with similar shapes, 35 representative wheelchair samples were finally selected, as shown in Fig. 4. For the uniformity and comparability of the experiment, the chosen representative sample images were processed using PS software into uniform-sized 25 cm × 25 cm images and decolourized as materials for the EGM interview experiment to facilitate subsequent observation by the subjects.

Step 2: Show the sample images to the subjects and ask them to divide the sample images into two categories based on their preferences: liking and disliking. This study invited 18 experts to conduct one-on-one interviews online or offline for approximately 30 to 60 min on the collected sample images. The respondents consist of 9 males and nine females, aged between 24 and 38, with 13 aged between 24 and 29 and 5 aged between 30 and 39. Regarding professional background and work experience, there are six design graduate students, six design teachers each, 4 product designers, and two mechanical designers. All participants have more than five years of industrial design experience. The detailed background information of the subjects is shown in Table 1.
Step 3: Inquire about the specific reasons why the subjects like the sample images and determine the key reason why the sample attracts users, which is the original evaluation layer (middle layer). At the beginning of the experiment, participants conducted detailed comparisons of wheelchair samples. They conducted in-depth interviews on their strengths, weaknesses, personal preferences, and other aspects to obtain preliminary reasons for product preferences. During the interview process, participants can remove samples of wheelchair products they do not like to ensure that the remaining samples can more accurately reflect their preferences.
Step 4: Conduct in-depth interviews with the subjects regarding their preferences for a specific sample using the EGM method. This step aims to obtain the upper-level abstract emotional preferences, middle-level original design items of specific attractiveness, and lower-level specific design elements triggered by the sample from the subjects.
Step 5: Construct a hierarchical relationship grid diagram between emotional adjectives and styling design elements. Based on the experimental results of the upper, middle, and lower evaluation items and the correlation between each level, an individual evaluation structure relationship grid diagram was drawn and saved as a document.
Step 6: Use the KJ simplification method73 to merge identical or similar attribute items; repeat this step until no further grouping is possible to obtain apparent attractiveness factors for the product. The number of interview project results collected through EGM experiments is vast. Specifically, there are 1918 upper-level evaluation projects, 1210 middle-level evaluation projects, and 312 lower-level evaluation projects. This study uses the KJ method to combine and simplify similar Kansei factors and design features to avoid burdening designers with too many attractive factors during the analysis process. After this step, the attractiveness factors were finally obtained, with 15 evaluation items at the upper level, nine at the middle level, and 26 at the lower level.
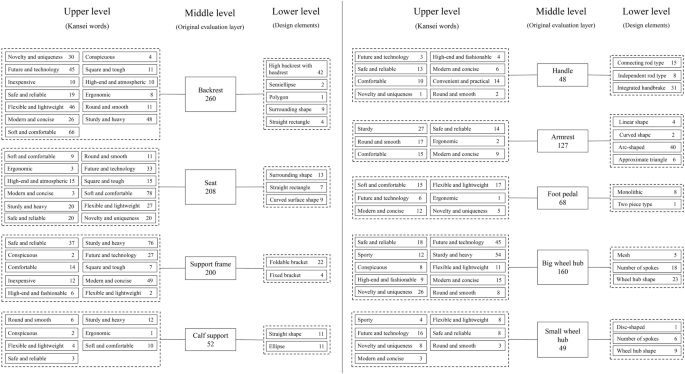
This series of refined evaluation projects has formed an attractive wheelchair product hierarchy logic diagram, thereby establishing a complete evaluation system and forming an evaluation grid diagram, as shown in Fig. 5.
Extraction of affective words
According to the frequency of positive adjectives mentioned by participants in personal interviews with EGM, 15 upper-level abstract Kansei adjectives are included. Kansei words and their frequencies are shown in Table 2. Based on the frequency of participants’ mentions, the nine most essential evaluation items were selected and paired into nine sets of Kansei word pairs through antonyms, as shown in Table 3.
To alleviate the cognitive load on participants in the next stage of SD evaluation and to prioritize the user’s Kansei needs in wheelchair form design. The SD method and FA method were used to determine the emotional needs of each user and the factor weights in the user’s emotional rating to identify critical emotional needs. Firstly, nine sets of Kansei word pairs were combined with 35 wheelchair samples to construct the Likert-7 scale, which ranges from − 3 to 3, specifically: − 3, − 2, − 1, 0, 1, 2, 3. In the scale, emotional words are placed on the left and right sides of the scale, and participants can score each wheelchair sample based on their subjective preferences. If the score tends towards a negative value, it indicates that the sample is more in line with the description of the left adjective (-3 is the most suitable). Conversely, if the score tends towards a positive value, it indicates that the sample is more in line with the description of the correct adjective (3 is the most suitable). Choosing 0 suggests that the subject holds a neutral attitude. The fifty-six participants were invited to participate in the SD assessment, including 32 males (average age of 28.38 years) and 24 females (average age of 26.96 years). By statistically processing the Kansei evaluation data of 35 wheelchair samples, the average value of each sample under each Kansei word pair was obtained. The specific statistical results are shown in Table 4.
Then, using the maximum variance method, exploratory FA is conducted through factor rotation to extract factors with eigenvalues threshold more significant than 1. Before performing dimensionality reduction on the ratings of 9 emotional word pairs, it is necessary to conduct KMO and Bartlett sphericity tests on the applicability of FA. The value of KMO is 0.712 (KMO > 0.6), and the significance P-value of Bartlett’s sphericity test is 0.000***(P < 0.05), indicating that there is a correlation between the variables and FA can be performed. Table 5 shows the total variance explanation of the Kansei factors, with three components having eigenvalues more significant than one and a cumulative contribution rate of 87.521%. The results indicate that the nine Kansei factors can be reduced to three main factors, which have good explanatory power for the appearance design elements of wheelchairs. In addition, to ensure the reliability of the statistical data obtained, we also conducted a reliability analysis on the questionnaire. Cronbach’s α value is an essential indicator for measuring the reliability of a questionnaire. The analysis results show that the Cronbach’s α value is 0.981. According to Taber74, a Cronbach’s α value of 0.7 indicates the questionnaire’s satisfactory reliability or internal consistency. Therefore, the questionnaire results of this study demonstrate reasonable reliability.
The Kansei factors were orthogonally rotated using the Caesar normalization maximum variance method, and the rotated factor loading coefficients are shown in Table 6. Positive numbers indicate positive correlations between indicators, while negative numbers indicate negative correlations between indicators. In this study, users’ Kansei needs can be met by categorizing all Kansei words into three main types.
The first factor consists of three indicators: “round–square,” “technological–ordinary,” and “modern–traditional.” It is named “modern and technological” factor and has a maximum weight of 47.549%. This factor reflects that users prefer wheelchairs with modern technological design styles.
The second factor consists of “comfortable–uncomfortable,” “safe–dangerous,” and “sturdy–fragile,” and is named “safe and comfortable” factor with a weight of 30.259%. This factor indicates that users have higher requirements for the safety and comfort of wheelchair use.
The third factor consists of “concise–complex,” “lightweight–heavy,” and “affordable–expensive,” and is named “lightweight and concise” factor with a weight of 22.192%. This factor indicates that users desire a wheelchair with a simple design that saves time and effort and is convenient.
Based on the above factor analysis results, three critical quality characteristics that affect users’ emotional perception of wheelchair form were determined, namely modern technology sense, safety and comfort sense, and lightweight and concise sense, as the critical Kansei demand factors for wheelchair form design elements.
Deconstruction of design elements
While conducting interviews with experts using EGM, this study extracted the mid-level primary attractiveness factors, namely the reasons why users like the product, as critical components. In addition, based on the specific design elements of the lower layer shown in the evaluation grid Fig. 5, a systematic deconstruction of the appearance characteristics of the wheelchair was carried out using the morphological analysis method. The appearance hierarchy of the product design was deeply analyzed, and the corresponding relationship between the wheelchair product shape design and the original attraction factors was explored. According to the wheelchair product design system in this article, the morphological analysis method decomposes the wheelchair form into the following nine main parts: seat, backrest, support frame, armrest, big wheel hub, small wheel hub, handle, calf support, and foot pedal. Each section is subdivided into multiple design categories for more detailed analysis and comparison. Based on the aesthetic characteristics analysis of 35 wheelchair products, corresponding design element hierarchy categories were obtained. Furthermore, Auto CAD software was used to draw the design elements into 2D shapes, and the specific experimental results are shown in Table 7. It includes nine design features and 36 design categories and is coded.
Construction of product concept schemes
The design categories are decomposed based on the qualitative analysis of product form elements. In each design feature, only one design category is selected for arrangement and combination to reconstruct experimental survey samples and expand the survey from the sample library. In addition to the previously selected representative samples, a total of 126,000 (3 × 5 × 2 × 5 × 4 × 2 × 7 × 3 × 5) new wheelchair shape combinations were obtained by cross-combining the samples, thereby expanding and reconstructing the product shape sample library. However, in the experimental design, consideration was given to the cognitive redundancy of individuals regarding the existence of information. If a large amount of sample information is used for questionnaire surveys, it may lead to poor reliability and validity due to information overload. An orthogonal experiment (OE) design method was adopted to ensure the representativeness of the experimental group and avoid this problem75. However, this OE design belongs to several nonequal levels and cannot be directly used in the experimental table. According to the feature and category classification in Tables 7 and 9 product features are set as nine factors, and the number of categories for each feature is set as several corresponding nonequal level distributions. Sixteen experimental samples are extracted using the OE method. Using SPSSAU online analysis software, generate an OE plan table for feature and category data, as shown in Table 8.
Based on the shape contours of each design category, 2D shapes were first drawn using Auto CAD models (Table 7). Subsequently, using computer-aided technology, the 2D shapes were converted into 3D shapes using Rhinoceros 3D design modelling software, and the 3D model effects of the design categories are shown in Table 9.
Furthermore, based on the 16 design category combination schemes in Table 8 of the OE plan, a complete 3D product conceptual model was constructed using Rhinoceros 3D design modeling software, and the 3D model was rendered using Keyshot software to complete the conceptual scheme for creating the wheelchair. For example, the design category combination of Scheme 1 is C11, C21, C32, C41, C53, C62, C71, C81, and C94. Based on the shape and functional layout of the wheelchair, a frame structure model of the wheelchair is constructed using steel pipes, and each design element is placed in the corresponding position of the wheelchair frame to build the conceptual scheme of the wheelchair. Similarly, the other 15 wheelchair concept schemes were constructed in the same way, resulting in 16 wheelchair concept schemes, as shown in Fig. 6. These 16 schemes will be the objects of SD evaluation in the next stage.

16 wheelchair concept schemes.
Construction of mapping model
Establishing a mapping model between user emotional imagery and product form features is the core of KE, but the relationship between the two is often highly nonlinear. BPNN is a mature machine learning technique that can effectively fit this mapping relationship and achieve prediction of user emotional perception. In addition, to enhance the predictive performance of BPNN, this study introduces the GWO algorithm into BPNN. Through multiple iterations of the GWO algorithm, the global optimal weights and thresholds were obtained, and the weights and thresholds of BPNN were optimized to improve the gradient information of BPNN and shorten the error. This study compared the performance of two algorithm models, BPNN and GWO-BPNN, and selected the better emotion prediction model. Select mean squared error (MSE) and mean relative error (MBE) as indicators to evaluate the model’s performance. The construction process of the GWO-BPNN prediction model is shown in Fig. 7. In addition, the general steps of the GWO algorithm are as follows:
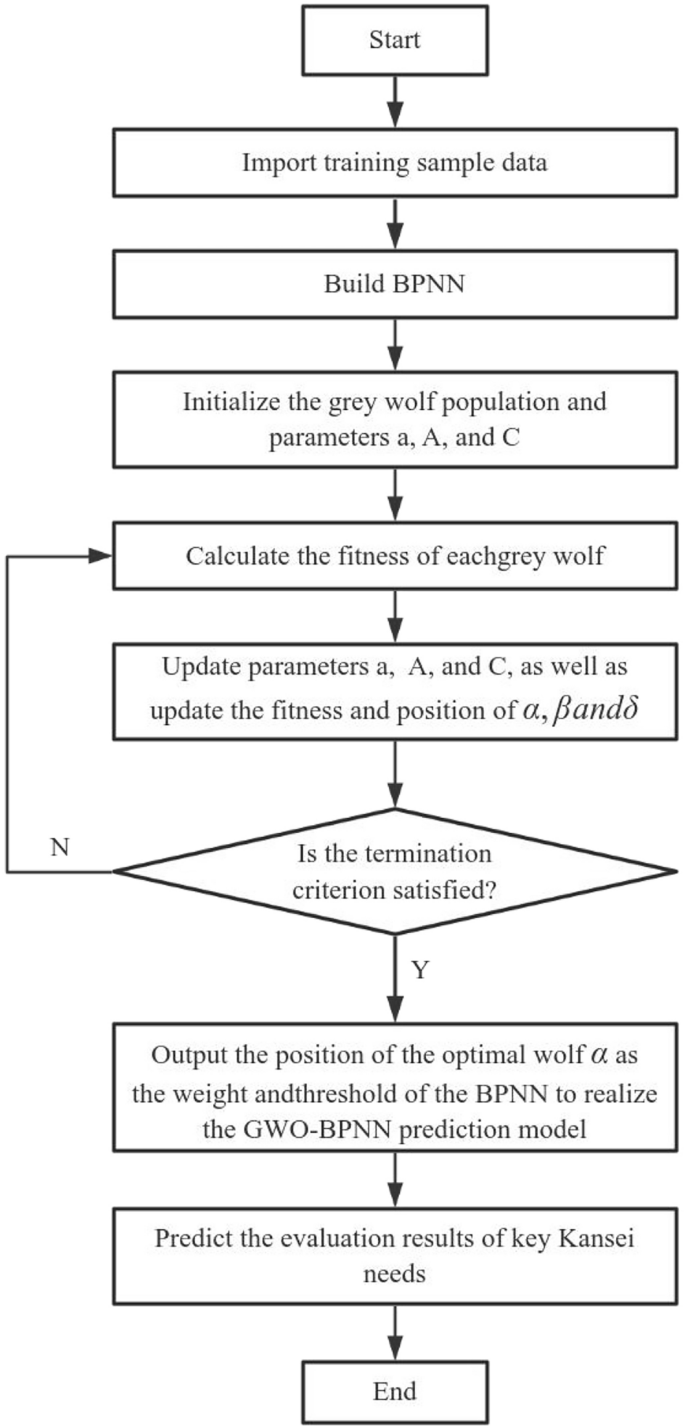
Construction process of GWO-BPNN prediction model.
Step 1: Normalize the sample data using Eq. (12).
$${{\text{x}}_{\upalpha }} = \frac{{{{\text{X}}_{\upalpha }} – {{\text{X}}_{{\text{min}}}}}}{{{{\text{X}}_{{\text{max}}}} – {{\text{X}}_{{\text{min}}}}}}$$
(12)
Among them, Xmax represents the maximum value in the original data, Xmin represents the minimum value in the original data, and Xα represents the normalized data.
Step 2: Build a BPNN and use Eq. (13) to calculate the number of hidden layer neural nodes.
$$\text{H}=\sqrt{\text{M}+\text{N}}+\text{a}$$
(13)
Among them, H is the number of hidden layer nodes, M is the number of input layer nodes (number of design features), N is the number of output layer nodes (number of Kansei words), and a is an integer between 0 and 10.
Step 3: Initialize GWO parameters. Determine the size of the grey wolf population, maximum iteration times, dimensions and upper and lower bounds of the grey wolf individual position information, and randomly initialize the grey wolf position.
Step 4: Calculate the fitness value of individuals, set the weights and thresholds of BPNN as the optimization objects of the GWO algorithm, use the total error of each neuron node of BPNN as the fitness function of the GWO optimization algorithm, measure the quality of individual positions, and obtain the current position with the best fitness value.
Step 5: Determine whether the maximum number of iterations has been reached. When the number of iterations reaches the upper limit, the GWO optimization algorithm ends and finally obtains the optimal initial weights and thresholds for BPNN.
Step 6: Output the position of the optimal wolf \(\alpha\) and map it to the weight matrix, which serves as the weight from the hidden layer to the output layer of the BPNN, to implement the GWO-BPNN model.
Step 7: Preprocess the test sample data, input it into the trained GWO-BPNN model, obtain the predicted results, and compare them with the actual values to verify the model’s reliability.
Evaluation of key Kansei needs
Firstly, use Keyshot software to display all wheelchair concept schemes in Fig. 6 by dynamically rotating the wheelchair models of each scheme 360 degrees around the Z-axis of the model, with the model center as the origin, for 5 s, and rendering them as 3D dynamic videos. Then, using the SD method, the 3D dynamic videos of 16 wheelchair concept schemes were combined with three key Kansei needs to design a key Kansei needs evaluation questionnaire for wheelchair representative samples. Invite 84 participants (42 males and 42 females, aged between 18 and 49 years) to rate the critical Kansei needs of 16 3D dynamic video wheelchair concept plans in three categories: “modern and technological,” “safe and comfortable,” and “lightweight and concise.” Participants can click multiple times to play the video for easy observation of the shape of the wheelchair concept plan. Taking “modern and technological” as an example, the evaluation scale is set to 1 to 7 points, where 1 point indicates that the sense of modern and technological style is not apparent, 2 points suggest that it is somewhat obvious, 3 points indicate that it is more prominent, 4 points suggest that it is pretty evident, 5 points indicate that it is pronounced, 6 points suggest that it is pronounced, and 7 points indicate that it is pronounced.
The critical Kansei needs evaluation steps for this stage are as follows: The first step is for the subjects to fill in their personal information. Step 2: Play the 3D dynamic video of each wheelchair concept scheme and watch the overall 3D form effect of the scheme, as shown in Fig. 8. Take a screenshot of the 3D dynamic video of the scheme. The third step is to rate the three Kansei needs of the wheelchair concept plan being viewed. Repeat steps two and three until the evaluation of 16 wheelchair concept schemes is completed.

Screenshot of 3D dynamic video of sample.
After completing the data collection, calculate the average score of each solution on the Kansei requirements. Then, combining the factor weights of essential Kansei needs, a weighted calculation is performed to obtain each scheme’s comprehensive Kansei evaluation value, as shown in Table 10. The highest comprehensive Kansei evaluation value for Plan 14 is 5.13, and the lowest is 3.946 for Plan 1. Through analysis, it can be found that conceptual scheme 14 has the best combination of shape optimization design categories, specifically including curved rectangular seats, polygonal backrests, foldable support frames, curved armrests, connecting rod type handles, two piece type foot pedals, five-spoke large wheel hubs, elliptical calf supports, and five-spoke small wheel hubs.
Establishment of prediction model based on GWO-BPNN
Encode the morphological features of 16 wheelchair concept schemes, critical Kansei demand scores, and comprehensive Kansei evaluation values, and integrate them into a wheelchair morphological Kansei evaluation matrix, as shown in Table 10. Based on the Matlab R2022a software platform, the morphological features of 16 wheelchair concept schemes were encoded as independent variables, and the comprehensive Kansei evaluation value was used as the dependent variable, which was input into the GWO-BPNN model for training. Randomly select 12 out of 16 samples as the training set and the remaining four schemes as the testing set. During the training process, the training frequency is set to 1000, the learning rate to 0.01, and the minimum training error value to 0.000001. Using the formula (13), determine the appropriate number of hidden layer nodes to be 15 (MSE = 0.017526). After initializing the weights and thresholds of BPNN, use the GWO algorithm to initialize the objective function values of \(\alpha\), \(\beta\), and \(\delta\), and use formulas (1–11) to calculate fitness and update the positions of \(\alpha\), \(\beta\), and \(\delta\). The population size is set to 200. Finally, the position of the optimal wolf \(\alpha\) is output, and the weight matrix is mapped to optimize the weights and thresholds of the BPNN, achieving the construction of the GWO-BPNN model. Figure 9 shows where GWO-BPNN reaches its lowest fitness level after 40 training sessions. The comparison curve between the predicted results of the training set and the actual values is shown in Fig. 10. The comparison curve between the predicted results of the test set and the actual values is shown in Fig. 11. The predicted values, actual values, MSE values, and MBE values (MSE = 0.0329, MBE = 0.0334) of the test set are shown in Table 11, indicating that the GWO-BPNN model has an excellent fitting effect on the test set.

GWO-BPNN training results.

Prediction results of GWO-BPNN training set.

Prediction results of GWO-BPNN test set.
Comparison of prediction models
The data from Table 10 was used and inputted into BPNN for training. Randomly select 12 out of 16 samples as the training set and the remaining four schemes as the testing set. During the training process, the training frequency is set to 1000, the learning rate to 0.01, and the minimum training error value to 0.000001. In this study, the number of nodes in the input layer corresponds to 33 key design elements, and the number of nodes in the output layer is 1. According to formula (13), the appropriate number of hidden layer nodes is determined by selecting the minimum mean square error, ultimately resulting in 12 (MSE = 0.0253) nodes. The hidden and output layers use the Logsig and Purelin functions, respectively. The model is trained using the Trainlm gradient descent function. After multiple iterations, the model achieved good convergence on the training set. The comparison curve between the predicted results of the training set and the actual values is shown in Fig. 12. The comparison curve between the predicted results of the test set and the actual values is shown in Fig. 13. The predicted values, actual values, MSE values, and MBE values (MSE = 0.0923, MBE = 0.0739) of the test set are shown in Table 11. The fitting effect of the test model is good.

Prediction results of BPNN training set.

Prediction results of BPNN testing set.
This study selected a three-layer structure network with hidden layers. Among them, 33 design elements are the network’s input layer, and the comprehensive Kansei evaluation value is the output layer. Train the network using BPNN and GWO-BPNN algorithms. Moreover, the prediction results will be analyzed using the comprehensive Kansei evaluation values of four test samples, and the error values of the two prediction models on the test set (Table 11) will be compared to identify the model with the highest predictive ability. According to the error values in Table 11, the MSE of the BPNN model is 0.0923, while the GWO-BPNN model is 0.0329, significantly better than the BPNN model. The results indicate that the GWO-BPNN model better predicts the comprehensive Kansei evaluation value of wheelchair shape design than the BPNN model. The results suggest that the GWO-BPNN model better predicts the comprehensive Kansei evaluation value of wheelchair shape design.
link
")


